
Vero Beach weather and climate
Vero Beach weather changes through the year, with warmer, wetter months and a cooler, relatively drier period. To plan beyond a short forecast, the monthly climate normals below provide a historical reference. They describe patterns at the Vero Beach International Airport station, not the weather at every beach or the conditions on a particular day.
The National Oceanic and Atmospheric Administration (NOAA) figures use the normal period 1991 to 2020. The station report was generated on 13 March 2026; its values are not measurements of the weather in 2026. Consult a current forecast for the dates and activities you are planning.
The best time to visit guide connects these patterns with activities. For current access and water safety, also consult the beach guide and local warnings.
How to read the monthly normals
The table gives the mean daily maximum and minimum air temperature, followed by mean monthly precipitation. A daily maximum is the average of daily highs over the reference period, not a record high. The minimum is the average of daily lows, not a prediction for a particular night.
Precipitation is a monthly total averaged over the reference years. It does not show when rain falls within a month or how much will fall during your stay. Values are shown in degrees Celsius and millimetres, converted from the NOAA report and rounded to one decimal place.
| Month | Mean daily high °C | Mean daily low °C | Precipitation mm |
|---|---|---|---|
| January | 22.9 | 11.2 | 69.6 |
| February | 24.2 | 12.5 | 55.9 |
| March | 25.8 | 14.3 | 87.4 |
| April | 27.7 | 16.9 | 77.7 |
| May | 29.8 | 19.9 | 106.7 |
| June | 31.6 | 22.3 | 171.7 |
| July | 32.5 | 22.9 | 144.3 |
| August | 32.6 | 23.1 | 186.7 |
| September | 31.3 | 23.0 | 178.8 |
| October | 29.3 | 20.6 | 135.4 |
| November | 26.3 | 16.3 | 73.9 |
| December | 24.1 | 13.4 | 64.5 |
Our pick: a boat trip
The pontoon trip from Merritt Island is an option for time on the water, subject to weather conditions.
Hand-picked tours, booked through GetYourGuide. Prices are indicative starting prices in US dollars (as of October 2026). Tap a tour for live availability and the current price in your currency.
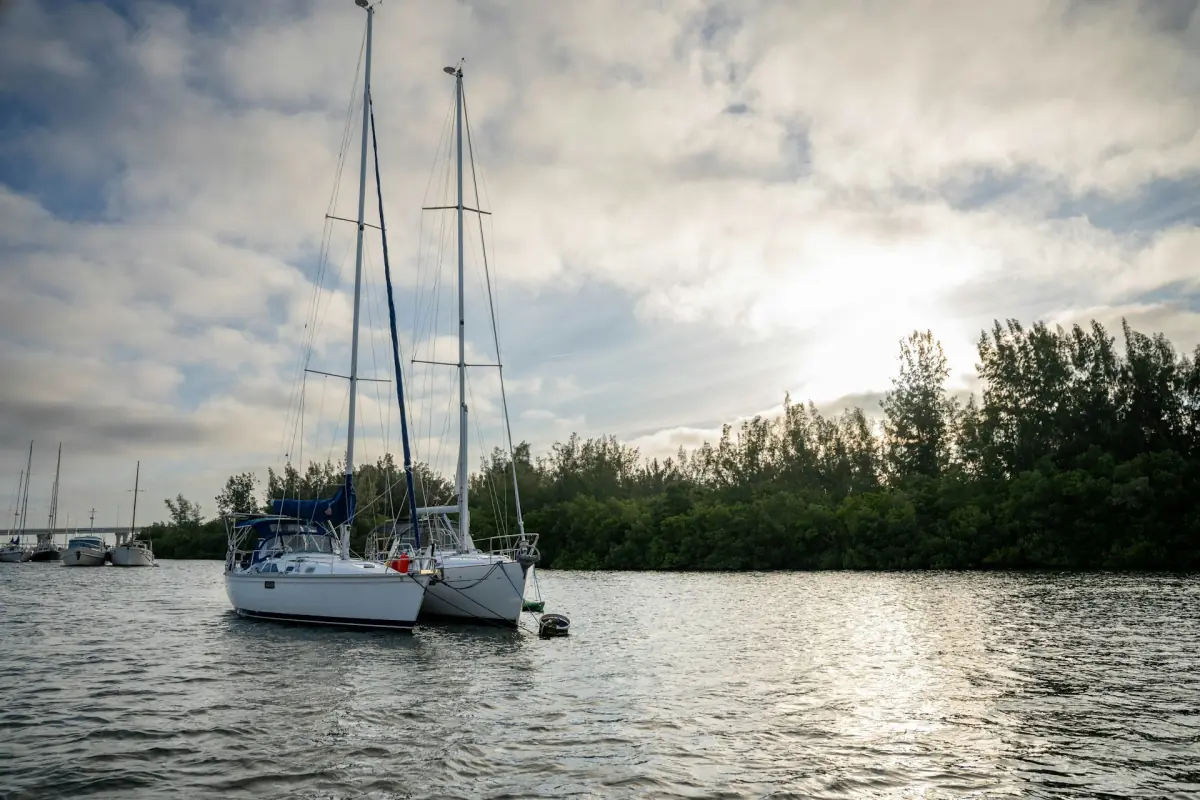
Lagoon boat outing
Consider a weather-dependent pontoon trip starting on Merritt Island.
Cooler months and changing conditions
The normals show lower temperatures in winter than in summer. January has a mean daily maximum of 22.9 °C and a mean daily minimum of 11.2 °C. Those two figures describe a typical daily range in the historical data, rather than limits that the weather must stay within.
November through April were generally cooler and drier than June through September in this dataset. That comparison can help with long-range planning for walks and outdoor visits, but a single wet day can occur in a historically drier month. Check the forecast before deciding what to bring and when to go outside.
Conditions can vary during the day. Keep a flexible plan if you want to combine the Atlantic side with stops around the lagoon. The visitor guide includes garden, museum and nature centre options to consider alongside time outdoors.
Warmer and wetter months
From June through September the historical normals show higher temperatures and greater monthly precipitation than the cooler part of the year. August has a mean daily maximum of 32.6 °C and a mean monthly precipitation total of 186.7 mm. These figures are averages across the reference period, not a forecast for a particular August.
When planning a water activity, check the actual weather and any instructions from the operator for your date. A pontoon boat option begins on Merritt Island, north of Vero Beach. Its operation depends on conditions, so leave room in the itinerary for a change and confirm the meeting details.
The wider Indian River Lagoon guide explains the estuary and its wildlife. The lagoon and the Atlantic are different settings; conditions on one side should not be assumed to describe the other.
Air temperature, surf and warnings
An air temperature reading does not measure wave height, rip currents or water quality. Before a beach visit, check the current marine and coastal warnings and follow directions at the access point. Lifeguard schedules at the city ocean parks vary, so plan around the information available on the day.
On 1 November 2026 the National Weather Service advised against entering the surf in a warning covering Coastal Indian River. The warning described high surf through 2 November and a high rip current risk into late 4 November. It is a dated notice, not a permanent description of local conditions.
An open beach entrance or parking area is not a general swimming clearance. If the ocean is unsuitable, reconsider the day using current conditions rather than assuming that another water activity is automatically safe. Weather, access and the activity provider’s instructions all matter.
FAQ
Are these current weather measurements?
No. The table shows NOAA normals for 1991 to 2020, based on the Vero Beach International Airport station.
What does monthly precipitation mean?
It is the mean monthly total in the reference period, not a prediction for the days of your stay.
Does a warm air temperature mean safe surf?
No. Check current waves, rip current warnings and local instructions separately.
Can I plan a boat trip from the climate table alone?
Use the table for seasonal context, then check the current forecast and the operator’s instructions for your date.